News (2024)
Back To:
Version 0.8.6 Preview: (October 26, 2024) - permalink
Officially, I don't plan on releasing v0.8.6 until next year since there isn't a whole lot of new stuff yet. I've since started a new job so the amount of free time I have has essentially dropped to zero. But I will pull it forward if some of the new and upcoming hardware (9800X3D or Arrow Lake) manages to find its way to my desk.
I am particularly interested in building optimized profiles for the Ryzen 9700X and 9800X3D to see how much they differ due to the extra cache. Though as of this writing, I do not have either chip.
In the event that does happen, here's what has so far made it into v0.8.6...
Tuning Profiles:
|
The Zen4 binary will have 2 trained profiles. Generic profiles also exist in case the trained profiles do not run well on a particular system. |

As you all know, y-cruncher has about a dozen different binaries which are optimized for differnet CPUs going back almost 2 decades. But while this goes a long way to maximizing performance of every processor line, it fails to handle variations within the same processor line.
For example, a Zen4 laptop, Zen4 desktop, and Zen4 server are all very different. While the CPU architecture itself is the same, the cache and memory topologies are completely different. What is optimal for one is not optimal for the others. As of today, most of the binaries are optimized for the top-end desktop of that generation - which may or may not be efficient on laptops or servers of that same generation.
To help combat that problem, v0.8.6 will add support for tuning profiles. These are profiles within each binary that you can select from. For example, the Zen4 binary (22-ZN4) has two main profiles: One for the desktop 7950X and one for the laptop 7940HS.
The table below shows how each CPU runs faster on its own profile than on the other (incorrect) profile:
10 Billion Digits of Pi - (times in seconds) CPU / Profile "Kizuna" (Raphael 7950X) "Saki" (Phoenix 7940HS) Ryzen 9 7950X @ stock
128 GB @ 4800 MT/s
235.082 275.812 Ryzen 9 7940HS* @ stock
96 GB @ 5600 MT/s
463.296 395.041
*Huge thanks to Framework Computer for providing me this amazing review sample of their Framework 16 laptop.)
For this initial release of the tuning profiles, there will only be a set of hard-coded profiles that are tuned for the various machines in my laboratory. Which means there will be no server profiles since I currently do not have server hardware. Currently, it's not possible to allow others to generate their own profiles since the process is not fully automated and requires compiling y-cruncher itself which is closed sourced.
Oh... and if it isn't obvious enough already, yes v0.8.6 will come with performance changes - potentially large ones. So competitive overclockers should be prepared to re-bench everything. Though as of now, it's too early for me to give any numbers yet since the new tuning model hasn't been finalized yet.
|

Core Affinity:
One of the various complaints/requests I've received recently is that y-cruncher cannot be taskset or bound to specific cores on the system. The reason for this is that most of the parallel frameworks that it use set their own core affinities - thus overriding what the user specifies.
Starting from v0.8.6, the Task Queue and Push Pool frameworks will support setting explicit core affinities. Additionally, there will be QoL options to quickly enable/disable hyper-thread cores as well as entire ranges of cores.
This may prove useful for systems where SMT is detrimental to performance as the only way to disable SMT is in the BIOS which requires rebooting.
The core affinities is part of a larger internal refactor that could potentially improve performance on larger Windows systems with multiple processor groups. But that remains untested for now.
Integration Improvements:
Being a fairly popular benchmark and stress-test, it is wrapped by other programs like BenchMate for HWBOT and CoreCycler (and possibly others).
The problem is that y-cruncher was never really intended for this type of integration, so the developers of such wrappers had to go to extensive lengths to "hack" their way into the program to properly intercept the output and send commands. Because these hacks were... hacks, they had issues supporting non-standard console manipulation such as the console colors and refreshing status lines. Furthermore, each time I changed how those worked, it would break the integration.
Starting from v0.8.6, there will be new options to control the following:
- How y-cruncher does manipulates the console. (WinAPI or Virtual Terminal escape sequences)
- How y-cruncher does the refreshing status lines. (overwrite the line, or don't refresh at all)
In addition to the above, v0.8.6 will have proper output logging. This solves the problem where piping or redirecting y-cruncher's output to a file will result in garbled output from terminal escape sequences.
Gamma(1/5) Joins Ranks (almost): (October 20, 2024) - permalink
The Gamma function has been a common secondary target of high precision computation with Gamma(1/4) and Gamma(1/3) being the main constants. And while there is no known fast algorithm to evaluate Gamma(x) for an arbitrary x, there exist very fast algorithms Gamma(n/24) for integer n.
But what about Gamma(1/5)? Vidunas (2008) gives the following formula:
While H1 and H2 are hypergeometric series that can be rapidly summed up, they are only logarithmically convergent. So we are close, but close is not enough.
This is partly the reason why Gamma(1/5) has not been computed high precision. There are no known fast algorithms to do so. While there does exist an algorithm to evaluate Gamma(x) for algebraic x in quasi-linear time, it is slow, complicated, and cannot be done with y-cruncher's custom formula functionality*.
Well, that changes today. Gerd Lamprecht has found alternate hypergeometric series for H1 and H2 which are geometrically convergent. Thus, it finally brings Gamma(1/5), and in general, Gamma(n/60) into the "extremely computable" realm that is accessible with y-cruncher.
Formula File: Gamma(1d5) - Vidunas-Lamprecht (2024).cfg
Gerd has so far taken this formula to 3 billion digits on rather modest hardware - which is already orders of magnitude larger than previous computations. Likewise, we expect this number to grow drastically in the future.
There is one problem though... This is the *only* fast formula for Gamma(1/5). And in order to set records, we need *two* independent algorithms. So before we can add Gamma(1/5) to the leaderboards, we need that 2nd formula.
Anyone out there willing to take the challenge? Find an alternate formula for Gamma(1/5) that can be implemented with y-cruncher's custom formula feature.
*The generic algorithm for Gamma(x) with algebraic x involves approximating the gamma function with the lower incomplete gamma function evaluated at a very large value. The difficulty here is that the series for the lower incomplete gamma function is confluent hypergeometric. The series initially diverges for many terms before finally converging. y-cruncher's generic series implementation currently cannot handle this type of series (mis)behavior. While the Euler-Mascheroni constant (which y-cruncher supports) also involves a series that exhibits temporary divergent behavior, it is specially handled for that specific series. So while it is technically possible to do another specialized implementation for the lower incomplete gamma function, it is not worth the development effort for lower profile constants.
Zen5's AVX512 Teardown: (August 7, 2024) - permalink
AMD's Zen5 has officially launched. That means another architectural teardown of the AVX512!
Zen5 Optimizations: (July 20, 2024) - permalink
Optimizations for AMD's upcoming Zen5 processors has been released for y-cruncher v0.8.5. The latest build (9542) will a new binary "24-ZN5 ~ Komari".
At this time, I cannot say much other than the following:
- The speedup of "24-ZN5" over "22-ZN4" is greater for single-threaded computations than multi-threaded computations.
- The BBP program has not changed. Both "22-ZN4" and "24-ZN5" have the same BBP code.
- None of the existing binaries have changed other than a minor bug fix. So existing benchmarks done with them will not be invalided by this update.
So if you are hardware reviewer who will be using y-cruncher for a Zen5 review, you will want to include single-threaded and BBP benchmarks. Furthermore, I only expect speedups to happen on the Granite Ridge desktop CPUs. I do not expect any speedup on the Strix Point laptop CPUs due to their cut-down AVX512.
Version v0.8.5 Released: (July 1, 2024) - permalink
y-cruncher v0.8.5 has been released without Zen5 optimizations for now. Once I get final Zen5 hardware, I intend to follow up with an update to add it.
Originally, I intended to wait for the Zen5 binary to be ready before releasing v0.8.5. But it is now July and multiple media outlets are asking me about it since all signs are pointing at an end-of-July launch for Zen5.
y-cruncher v0.8.5 is a rather big update from v0.8.4 with new optimizations and a new benchmark category (the BBP). Thus hardware reviewers will need to rerun all benchmarks on older hardware. And this takes time.
So to allow reviewers to get started on this early, I decided to branch-cut v0.8.5 early and push out a release without the Zen5 binary. When the final hardware arrives and the final optimizations/tuning is done, there will be an update to this release just for that. All existing binaries will not be affected and will be speed identical to today's release.
Related: Version 0.8.5 Preview
|
Note that the CPU Utilization of 3.33% is wrong. There is a yet-to-be-resolved issue that is causing long runs on many cores to bug out this measurement. |

Pi Record Smashed at 202 Trillion Digits: (June 28, 2024) - permalink
StorageReview wasn't kidding when they said they were running a very large computation at the end of this video.
The previous record of 105 trillion digits set earlier this year was frought with problems. And with those lessions learned, this time it was done right.
Compared to last time, these changes were made:
- Switched to an Intel machine which lacks the superalignment hazard that plagues AMD processors. While the Intel machine was less powerful than the AMD one from last time, compute power is not the bottleneck. Thus getting rid of the hazard is more important.
- Better storage configuration with most issues from last time resolved. So no more silly bottlenecks holding everything back.
- Picked up fixes for 2 of the y-cruncher bugs discovered during the 105 trillion digit run. (the N63 bug + error handling crash)
See StorageReview's blog for more details!
Computation Statistics:
Decimal Digits: 202,112,290,000,000 Total Time: 104 days
(February 6, 2024 - May 20, 2024)
CPU: 2 x Intel Xeon Platinum 8592+ (128 cores, SMT off) Memory: 1.0 TB DDR5 Storage: Swap: 22 x Solidigm P5336
Digit Output: 6 x Solidigm P5336
OS: Windows 10 Build 20348 Software: y-cruncher v0.8.3.9532 (with developer fixes) Validation File: Validation File Verification: Screenshot
This computation was interrupted just once. It was started before the previous 105 trillion digit run even finished. And thus it began using the same (bugged) version of y-cruncher which broke that computation. Thus the interruption was necessary to switch to a patched binary with the bare minimum fixes to finish it off.
Barring that program swap, this easily could have been a single contiguous run.
Overall, this was a really fast computation relative to its size. And there were no errors or other complications. So y-cruncher's fault tolerance wasn't even tested this time.
Given that this computation went so well and there's nothing else to talk about, we can ask the question, how far can the Pi record be pushed on today's hardware?
What's the Limit?
When trying to estimate what is possible, we need to look at the typical bottlenecks that prevent going higher. And given the current setup of running on a single system, the limiters are:
- Time Limit: 100 - 300 days
- Storage in one System: 1 - 3 Petabytes
- Limit of Reliability: Unknown, likely "a few years".
Historically speaking, cost has not been a major issue. While the hardware involved is very expensive, it is not "consumed". So the cost comes from power consumption, opportunity cost of the hardware, and maintainence. Recent records have also been trending towards advertisement compaigns for products and services where there is more willingness to spend resources.
Time Limit:
While there is technically no time limit to a computation, there are some implicit ones imposed by external forces.
The main time limit is human patience. 100 - 200 days seems to be the limit of what people are willing to plan for. While some of the Pi records have run longer than that, they typically were the result of complications that led to overruns. To my knowledge, nobody has willingly attempted a computation knowing that it would take longer than a year.
Let's say you were willing to wait for more than a year. How far is the limit now? At some point, the exponential growth of hardware and software* improvements will catch up to you. This means that you can set a record faster by waiting for better hardware/software to arrive, then running it later. As of today, I estimate this limit to be around 3 years. Meaning that if you wanted to run a computation that would take 3 years, you're probably better off waiting 2 years for hardware/software to arrive that can do it in less than 1 year.
*I hesitate to include software as part of "exponential growth". But in reality, exponential improvement in hardware is only possible if software is updated to utilize it. (think parallelism, vectorization, etc...) Though in another (comedic) view, software in general does in fact "grow exponentially" - in the wrong direction (i.e. modern bloatware).
Storage in one System:
This is perhaps the most obvious of the limits. You can't run anything larger than you can store. As of today, the densest form of storage is actually enterprise SSD. (Enterprise SSD is denser than even hard drives.) Thus with enterprise SSDs, you can cram roughly 1 - 3 petabytes of it in one system. This puts a limit of around 500 trillion to 1 quadrillion (1015) digits.
It is possible to further expand storage by moving off system, but then you start testing the bandwidth capability the network or whatever interconnect is used. This opens up a different can of worms around hierarchical storage - which is something that y-cruncher working towards, but is not there yet.
Limit of Reliability:
This is somewhat related to the time limit. The longer a computation runs, the probability of something failing catastrophicly increases exponentially.
y-cruncher has already gone to extreme lengths to extend this limit:
- Checkpoint restart allows computations to be interrupted and resumed. This allows going beyond the hardware's uptime MTTF (mean time to failure).
- 100% of swap space I/O is checksummed to detect silent data corruption in storage.
- 90-95% of CPU time is locally checksummed to detect soft errors.
In all, these will allow large computations to be done quite unreliable hardware.
In the history of y-cruncher Pi records, there has been one soft error and multiple hard drive failures - all occuring during the early records by Shigeru Kondo. Everything since then has been rather clean - partly because of these experiences leading to better education and thus better preparation in later computations.
And because of this, it's hard to estimate what the limit is on in modern times since reliability hasn't really been tested. If we assume that most modern hardware tends to start falling apart after "a few years", this would probably be the upper-bound of long computations.
Putting it all together, I don't see y-cruncher being used to go beyond 500 trillion digits in the next year or so - the limiter being time of computation. Though I wouldn't bet against it if enterprise SSDs keep rapidly increasing in performance and density.
|
|
| y-cruncher v0.8.5 will have two benchmark options. |


Version 0.8.5 Preview: (May 10, 2024) - permalink
y-cruncher v0.8.5 is coming out some time in the next few months with some changes:
- The BBP digit extractor is now a formal benchmark.
- Performance changes due to optimizations + compiler change.
- Possible Zen 5 Optimizations.
BBP is now a Formal Benchmark:
It's no secret that y-cruncher has becoming increasingly memory-bound in recent years. And at the rate at which this trend is continuing we're looking at a future where y-cruncher's main computations will eventually turn into a pure memory benchmark that negligibly touches the CPU.
So in order to "keep" y-cruncher as a CPU benchmark, I've decided to elevate the BBP digit extractor into a formal benchmark complete with benchmark validation.
So starting from v0.8.5, y-cruncher will have two benchmark options:
- The classic benchmark that computes all the digits of Pi from start to N.
- The BBP benchmark that computes specific binary digits of Pi.
For those who didn't already know, the BBP digit extractor implements the BBP algorithm which can directly compute binary digits of Pi far from the beginning without computing all the digits before it. This neat property makes it useful for verifying all the recent Pi world records and is why y-cruncher already has had it a sub-program.
Computationally, BBP is very different from the main computations as it uses no memory and is embarassingly parallel. Thus it is perfect as a pure CPU+SIMD benchmark that is unaffected by the ever-growing compute/memory gap. So if Zen 5 lives up to all the hype around its AVX512, we could potentially see a 2x IPC improvement in the BBP benchmark over Zen 4.
At this point it's unclear if HWBOT will pick up the new BBP benchmark since it already has one - namely GPUPI and GPUPI for CPU.
Performance Changes due to Optimizations + Compiler Change:
As hinted from the previous news blog, y-cruncher will be changing compilers to Intel's LLVM Compiler (ICX). This change will apply to all 64-bit binaries on both Windows and Linux. The 32-bit Windows binaries will remain with the Microsoft compiler.
Thus for the first time, y-cruncher will be able to directly compare Windows and Linux as both will be compiled with identical compilers.
Because the ICX compiler generates worse code than ICC, the baseline performance will drop by a few % on most processors. To counter this regression, v0.8.5 will be also be switching to a newly rewritten floating-point FFT implementation which will improve performance by a few %. The results on Windows are mostly offsetting with an overall speedup on all but 2 processors (Haswell and Skylake client) which will unfortunately get a tad slower.
Unfortunately, the situation for the BBP digit extractor is worse. ICX is far worse than ICC for the BBP program and there are no new optimizations to help offset it. So there will be a medium to large regression on the BBP.
|
|
| Stress tester will be a bit cluttered until SFT and FFT are removed in v0.8.6. |

To expand more on the new FFT implementation, the new FFT (FFTv4) replaces two older FFTs (FFTv2 and FFTv3) that are each more than 10 years old:
- FFTv2 was written in 2013 and is used by CPUs without FMA hardware.
- FFTv3 was written in 2014 and is used by CPUs with FMA hardware.
- FFTv4 was written this year and will replace both FFTv2 and FFTv3.
Prior to v0.8.5, the distinction between FFTv2 and FFTv3 was hidden from the user as only one is compiled at a time (depending on the binary) and both were given the same names in the stress-tester. In v0.8.5, you will see their full names along with the new FFTv4.
Like all the other old algorithms/stress-tests, the two old FFTs will eventually be removed. Their outdated designs have become a maintenance burden.
Possible Zen 5 Optimizations:
AMD's Zen 5 processor is expected to launch this year. And if all the hype about Zen 5's AVX512 capability is even remotely accurate, it will warrant a new binary.
I'm hoping to get this into v0.8.5, though it will depend on when I can get the suitable hardware to do the optimizations. If things play out the same way they did two years ago with Zen 4, this will happen ahead of launch in time for hardware reviewers to pick it up for their Zen 5 launch day reviews.
Countering the Compiler Regression with Optimizations: (April 3, 2024) - permalink
These kind of topics are hard to write about since it's not all positive. But let's start with a table because everyone hates walls of text:
| Processor | Architecture | Clock Speeds | Binary | ISA | 1 Billion Digits of Pi (times in seconds) | |||||
| v0.8.4 | v0.8.5 (ICC) | v0.8.5 (ICX) | v0.8.4 -> v0.8.5 | ICC -> ICX | Overall | |||||
| Core i7 920 | Intel Nehalem | 3.5 GHz + 3 x 1333 MT/s | 08-NHM | x64 SSE4.1 | 535.818 | 492.971 | 482.982 | +8.00% | +2.03% | +9.86% |
| Core i7 3630QM | Intel Ivy Bridge | stock + 2 x 1600 MT/s | 11-SNB | x64 AVX | 339.960 | 318.037 | 305.360 | +6.45% | +3.99% | +10.18% |
| FX-8350 | AMD Piledriver | stock + 2 x 1600 MT/s | 12-BD2 | x64 FMA3 | 225.749 | 218.338 | 216.159 | +3.28% | +1.00% | +4.25% |
| Core i7 5960X | Intel Haswell | 4.0 GHz + 4 x 2400 MT/s | 13-HSW | x64 AVX2 | 49.441 | 48.568 | 50.205 | +1.77% | -3.37% | -1.55% |
| Core i7 6820HK | Intel Skylake | stock + 2 x 2133 MT/s | 14-BDW | x64 AVX2 + ADX | 102.144 | 100.887 | 103.570 | +1.23% | -2.66% | -1.40% |
| Ryzen 7 1800X | AMD Zen 1 | stock + 2 x 2866 MT/s | 17-ZN1 | x64 AVX2 + ADX | 77.505 | 75.965 | 76.800 | +1.99% | -1.10% | +0.91% |
| Core i9 7940X | Intel Skylake X | 3.6 GHz (AVX512) + 4 x 3466 MT/s | 17-SKX | x64 AVX512-DQ | 20.686 | 19.912 | 20.428 | +3.74% | -2.59% | +1.25% |
| Ryzen 9 3950X | AMD Zen 2 | stock + 2 x 2666 MT/s | 19-ZN2 | x64 AVX2 + ADX | 34.814 | 33.292 | 33.161 | +4.37% | +0.39% | +4.75% |
| Core i7 11800H | Intel Tiger Lake | stock + 2 x 3200 MT/s | 18-CNL | x64 AVX512-VBMI | 35.739 | 34.438 | 35.052 | +3.64% | -1.78% | +1.92% |
| Ryzen 9 7950X | AMD Zen 4 | stock + 2 x 5000 MT/s | 22-ZN4 | x64 AVX512-GFNI | 18.978 | 18.848 | 18.937 | +0.69% | -0.47% | +0.22% |
ICC is Intel's old Classic C++ Compiler (ICC). And ICX is Intel's new LLVM Compiler (ICX). So we can see that:
- y-cruncher v0.8.5 will have new software optimizations that improves performance on all processors.
- Intel's new compiler (ICX) is worse than their old compiler (ICC) on nearly all modern processors.
In short, Intel's new compiler is causing a performance regression in y-cruncher. In order to prevent the next version of y-cruncher from actually getting slower, I am trying to offset the regressions with new performance optimizations - with only partial success so far.
But how did we get here?
Intel's classic C++ compiler has historically been the best compiler for code performance. However, starting from about 2020, Intel began migrating to a new LLVM-based compiler (ICX) which they wrapped up last year by discontinuing their old compiler (ICC). The problem is that for y-cruncher at least, ICX isn't actually better than ICC.
| Processor | Architecture | Clock Speeds | Binary | ISA | BBP - 10 billionth Hex Digit of Pi (times in seconds) | |||
| MSVC 17.7.1 | ICC 19.2 | ICX 2024 | ICC -> ICX | |||||
| Core i7 920 | Intel Nehalem | 3.5 GHz | 08-NHM | x64 SSE4.1 | 568.384 | 574.745 | 725.910 | -26.30% |
| Core i7 3630QM | Intel Ivy Bridge | stock | 11-SNB | x64 AVX | 525.811 | 436.337 | 464.628 | -6.48% |
| FX-8350 | AMD Piledriver | stock | 12-BD2 | x64 FMA3 | 251.695 | 231.205 | 235.828 | -2.00% |
| Core i7 5960X | Intel Haswell | 4.0 GHz | 13-HSW | x64 AVX2 | 55.249 | 50.640 | 53.422 | -5.49% |
| Core i7 6820HK | Intel Skylake | stock | 14-BDW | x64 AVX2 | 107.977 | 105.307 | 108.959 | -3.47% |
| Ryzen 7 1800X | AMD Zen 1 | stock | 17-ZN1 | x64 AVX2 | 97.809 | 97.915 | 95.269 | +2.70% |
| Core i9 7940X | Intel Skylake X | 3.6 GHz (AVX512) | 17-SKX | x64 AVX512-DQ | 13.518 | 13.561 | 15.340 | -13.12% |
| Ryzen 9 3950X | AMD Zen 2 | stock | 19-ZN2 | x64 AVX2 | 22.506 | 21.043 | 20.982 | +0.29% |
| Core i7 11800H | Intel Tiger Lake | stock | 18-CNL | x64 AVX512-DQ | 50.002 | 50.798 | 51.654 | -1.69% |
| Ryzen 9 7950X | AMD Zen 4 | stock | 22-ZN4 | x64 AVX512-DQ | 11.521 | 11.424 | 12.232 | -7.07% |
In other words, Intel got rid of their old compiler while their new compiler has yet to match it in performance. And because of the need to stay up-to-date with C++ features and CPU instruction sets, I cannot stay on an old compiler forever. Thus an "upgrade" is inevitable even if that hurts performance.
What about other compilers? If Intel's new compiler is bad, what about other alternatives? Well...
- Microsoft's compiler is overall worse than both of Intel's compilers.
- GCC is unusable on Windows due to this 12-year-old bug which shows no sign of ever being fixed.
- Clang I have not tested, but it is also LLVM-based like ICX. So I would be surprised if it was any better than ICX.
So even though Intel has made their compiler worse, it's still better than its competitors.
So why is Intel's new compiler worse than their old compiler?
There is no single regression in Intel's LLVM compiler that is responsible for the entire regression vs. their classic compiler. It's a combination of many regressions (and improvements) that collectively add up with the regressions winning in the end by several %. Anecdotally speaking, small regressions tended to involve inferior instruction selection and ordering while larger regressions tended to fall into these categories:
- Poor register allocation. Code that has too many live values to fit in registers tended to spill more on ICX than ICC. While this has improved in ICX2024, ICC remains superior here.
- ICX fails to align the stack for vector register spills. For large functions with many vector register spills, ICX does not align the spilled values. The result is misalignment penalties for register spills which is further aggravated by poor register allocation. The only way to align the stack requires using a compiler option that vendor-locks the code to Intel processors. Meaning that if you turn it on, the binary will not run on AMD processors.
- Loop-invariant Code Motion (LICM) and Common Subexpression Elimination (CSE) often combine to blow up the stack and code size.
- ICX is overly aggressive with loop optimizations that cannot be turned off without completely disabling optimizations.
This last category is particularly nasty. Complicated loop optimizations like loop-interchange, loop fusion/fission, loop materialization, aggressive loop unrolling, etc... are only turned on at maximum optimization level (O3) for most compilers due to their high risk of backfiring. However, I've observed that most of these are already enabled at O1 and O2 for ICX and are difficult or impossible to disable. And when such optimizations backfire, it can kill performance of the loop easily by a factor of 3x or more.
Below are some pseudo-code examples illustrating major ways that I have observed ICX loop optimizations to backfire. Actual code that experiences such behavior are generally much larger and more complicated in size. Self-contained samples have been provided to Intel's engineers in the hope that they can improve their compiler.
Example 1: Loop Fusion Gone Bad
double* A = ...;
for (size_t c = 0; c < length; c++){
double tmp = A[c];
// Long dependency chain.
A[c] = tmp;
}
for (size_t c = 0; c < length; c++){
double tmp = A[c];
// Long dependency chain.
A[c] = tmp;
}
In this example, the iterations of each loop are all independent and can be run in parallel. But within each iteration is a long dependency chain. In order to keep the iterations within the CPU reorder window, the work is intentionally split into multiple loops (more than just 2 loops as shown here). This allows the CPU to reorder across iterations - thus allowing instruction level parallelism.
However, ICX doesn't always allow this to happen. Instead, it sometimes decides to undo my hand optimization by fusing the loops back together into this:
for (size_t c = 0; c < length; c++){
double tmp = A[c];
// Super long dependency chain.
A[c] = tmp;
}
While this improves memory locality by traversing the array only once instead of twice. It has increased the dependency chain to the point that the CPU is no longer able to sufficiently reorder across iterations. Thus it kills instruction-level parallelism (ILP) and hurts performance. The compiler may be incorrectly assuming that the dataset does not fit in cache when in fact it does.
The same situation can happen with loop-interchange where ICX will interchange loops to improve memory locality at the cost of creating dependency chains that wipe out instruction level parallelism.
Example 2: Everything Blows Up
This example is a pathologically bad case where Loop-invariant Code Motion (LICM) and loop unrolling combine to create a perfect storm that simultaneously blows up instruction cache, data cache, and performance. While it looks rather specific, it is nevertheless a common pattern in y-cruncher.
Here the code is iterating an array of AVX512 vectors that uses 1000 scalar weights. Each time a scalar weight is used, it is broadcast to a full vector to operate on the array A. In AVX512, a scalar broadcast has the same cost as a full vector load. So there is no added cost of redoing the broadcast in the inner loop.
const double* weights = ...;
__m512d* A = ...;
for (size_t c = 0; c < length; c++){
__m512d tmp = A[c];
for (size_t w = 0; w < 1000; w++){
__m512d weight =
_mm512_set1_pd(weights[w]);
// Do something with "tmp" and "weight".
}
A[c] = tmp;
}
Instead, ICX has a tendency to turn it into the following:
const double* weights = ...;
__m512d* A = ...;
__m512d expanded_weights0 = _mm512_set1_pd(weights[0]);
__m512d expanded_weights1 = _mm512_set1_pd(weights[1]);
__m512d expanded_weights2 = _mm512_set1_pd(weights[2]);
...
__m512d expanded_weights999 = _mm512_set1_pd(weights[999]);
for (size_t c = 0; c < length; c++){
__m512d tmp = A[c];
// Do something with "tmp" and "expanded_weights0".
// Do something with "tmp" and "expanded_weights1".
// Do something with "tmp" and "expanded_weights2".
// ...
// Do something with "tmp" and "expanded_weights999".
A[c] = tmp;
}
What was supposed to be a bunch of (free) scalar broadcasts has turned into 64 KB of stack usage and two fully unrolled 1000-iteration loops - one of which is completely useless. In this example, this transformation is never beneficial as broadcast loads are already free to begin with. So replacing them with stack spills and trashing both the data and instruction caches only makes things worse. For small values of length, this transformation is devastating to performance due to the initial setup.
So what happened?
- The compiler first sees that the inner loop has a compile-time trip count. So it decides it can completely unroll it. I have never seen compilers completely unroll loops this large, but ICX apparently does it with several of y-cruncher's kernels.
- The compiler deduces that weights does not alias with A. Thus it sees that the loads and scalar broadcasts are loop invariant. So it pulls them out of the loop. Yes, all 1000 of them.
- Those 1000 values need to go somewhere right? So it spills them onto the stack (and also incurring any penalties due to stack misalignment).
To put it simply, other compilers do not do this kind of stuff. Or at least they have limits to prevent this from happening. ICX appears to be completely unrestrained.
A common theme among ICX misoptimizations is that Loop Invariant Code Motion (LICM) and Common Subexpression Elimination (CSE) will create additional live values that end up getting spilled to the stack, thus invoking a penalty that is often larger than the initial savings. The example above is a cherry-picked example where ICX takes this concept to the extreme resulting in an avalanche of secondary regressions such as misalignment penalties and cache pollution.
Conclusion:
Intel's LLVM compiler is undoubtly a very powerful compiler. And the more I study it, the more I am impressed with its ability. However, with power comes responsibility, and unfortunately I cannot say that ICX wields this power well. I have yet to investigate if these issues are in LLVM itself or in Intel's modifications to it. But regardless, as of today, Intel's LLVM compiler can be best described as a child running with scissors - young and reckless with dangerous tools.
How long will it take for ICX to reach ICC's qualty of code generation? I have no idea. And after waiting more than a year for this to happen, I've decided that it's probably not going to happen for a very long time. For every thing that ICX screws up, it probably gets 5 others right. But for code that has already been hand-optimized, getting it right is neutral while getting it wrong hurts a lot. Dropping down to assembly is not an option because there are "thousands" of distinct kernels which are largely generated via template metaprogramming.
Is y-cruncher the only application affected like this? Probably not.
Limping to a new Pi Record of 105 Trillion Digits: (March 14, 2024) - permalink
|
If the bug that was fixed in v0.8.3.9533 made you suspect something was happening, you were right.
Jordan Ranous from StorageReview has followed up last year's speedrun of Pi with a record this time: 105 trillion digits of Pi
Originally, this was supposed to be another speedrun with slightly more digits to set the record. But it turned into anything but that as it ran into a multitude of problems. So unlike the majority of the past Pi records done with y-cruncher, this one did not go smoothly. And for the first time in over 10 years, a Pi record attempt required developer intervention to complete. So unlike the majority of past records, I was very much involved in this one.
But in the end, a record is still a record. It doesn't need to be pretty.
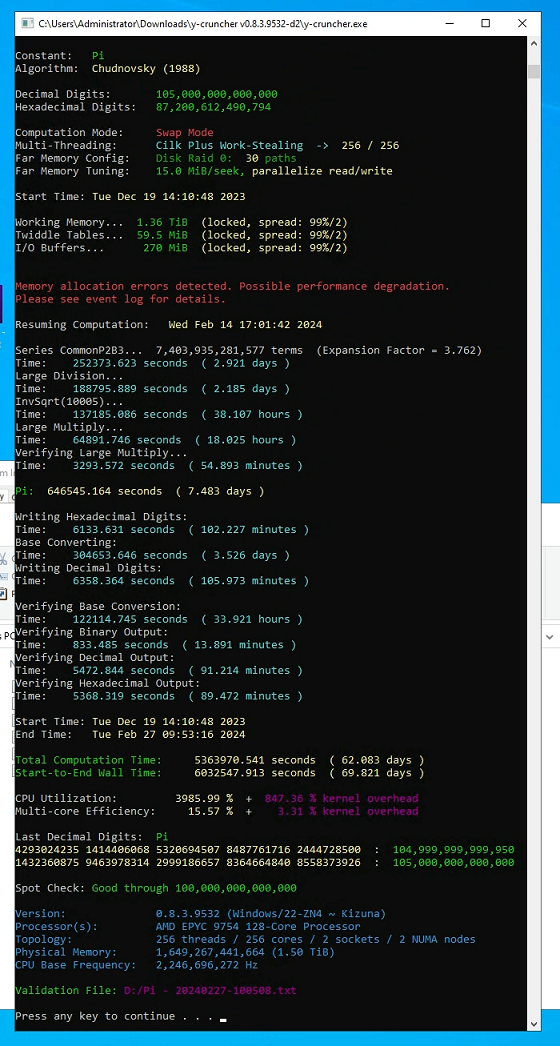
Computation:
Decimal Digits: 105,000,000,000,000 Total Time: 75 days
(December 14, 2023 - February 27, 2024)
CPU: 2 x AMD Epyc 9754 Bergamo (256 cores, SMT off) Memory: 1.5 TB DDR5 Storage: Swap: 30 x Solidigm P5316
Digit Output: 6 x Solidigm P5316
OS: Windows Server 2022 (21H2) Software: y-cruncher v0.8.3.9532 (with developer fixes) Validation File: Validation File
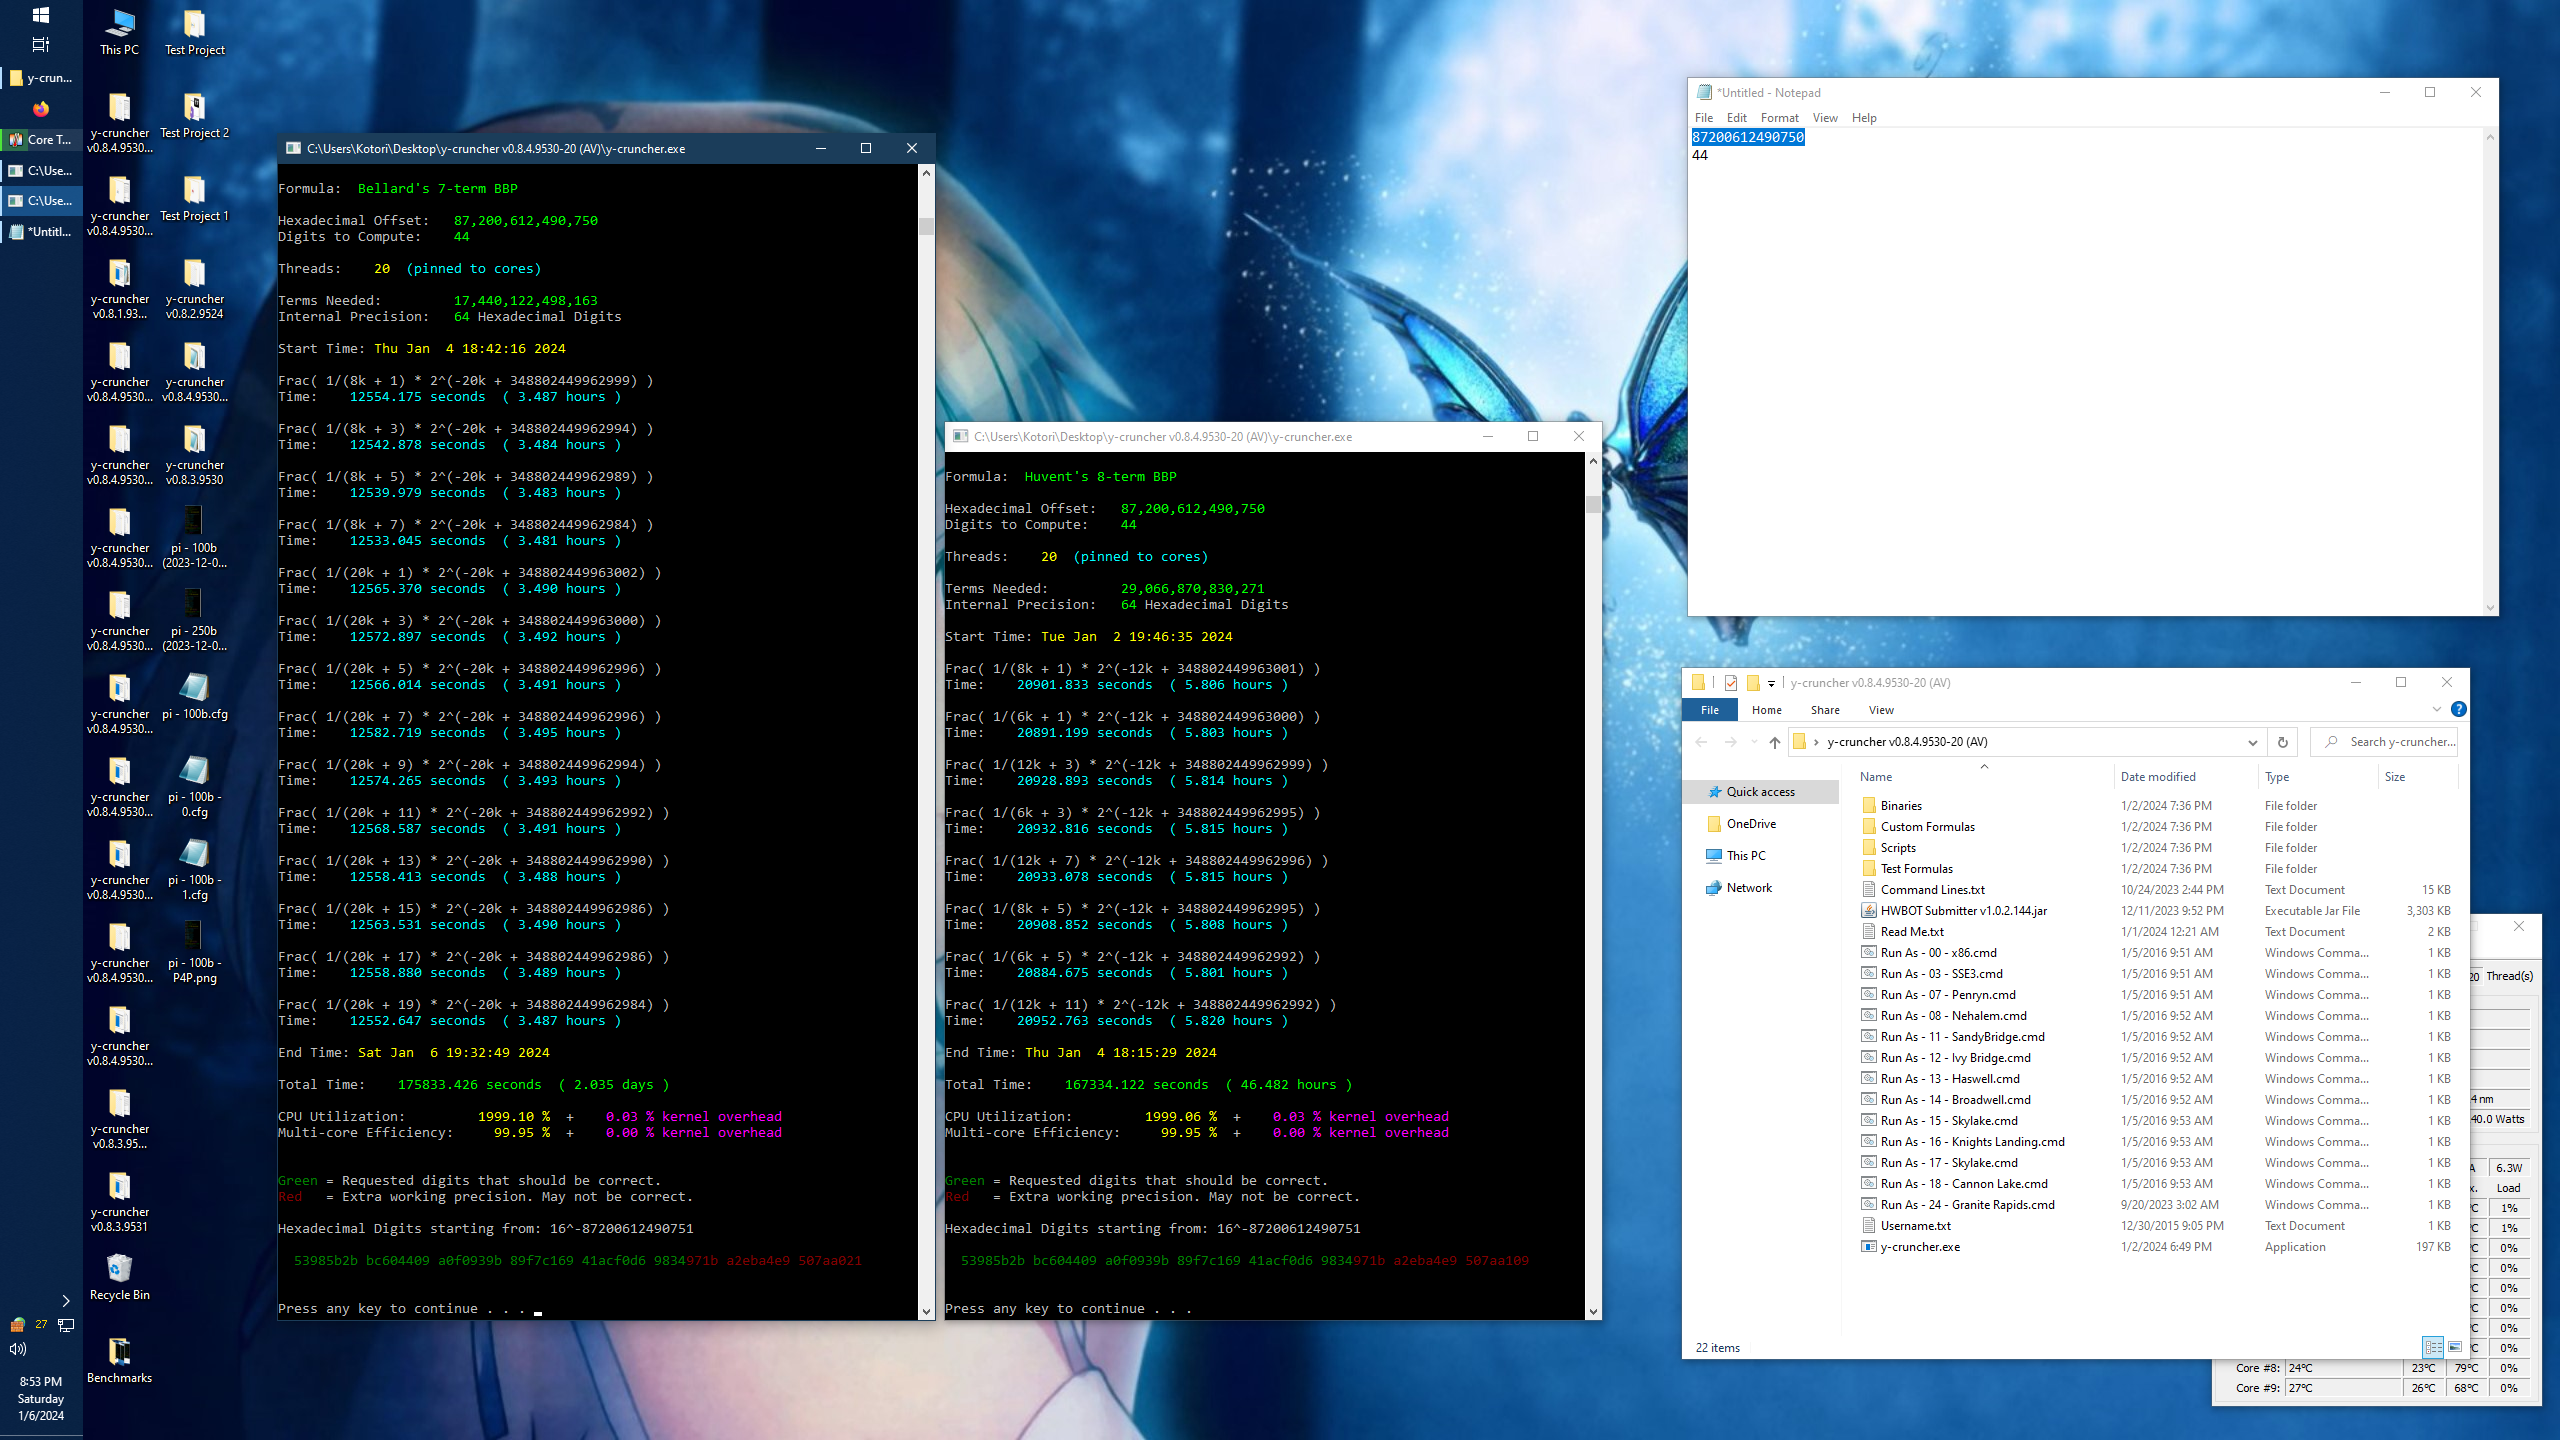
Verification (x2):
Total Time: 4 days
(January 2, 2024 - January 6, 2024)
CPU: Intel Core i9 7900x @ 3.6 GHz (AVX512) Memory: 128 GB DDR4 OS: Windows 10 (22H2) Software: y-cruncher v0.8.4 (early development build) Screenshot: Screenshot
The Original Plan:
As stated, the goal was to repeat last year's 100 trillion digit speedrun, but with better hardware and better software:
Last Year's 100 Triillion Digit Speedrun This 105 Trillion Digit Record Run CPU: 2 x AMD Epyc 9654 (Genoa)
192 Cores
2 x AMD Epyc 9754 (Bergamo)
256 Cores
Memory: 1.5 TB DDR5 1.5 TB DDR5 Storage: 19 x Solidigm P5316 36 x Solidigm P5316 Software: y-cruncher v0.7.10.9513 y-cruncher v0.8.3.9532 + fixes
The main improvements were the larger number of cores, greater storage bandwidth, and all the recent improvements to y-cruncher including the SSD ones.
This was supposed to only take a month, but as mentioned, things did not go as planned and it ended up dragging out for more than 2 months - longer than last year's computation.
Below Expected Performance:
A couple weeks into the computation, the first thing that began to go awry was the performance.
|
Poor Sustained I/O Bandwidth (blue = read, purple = write) |
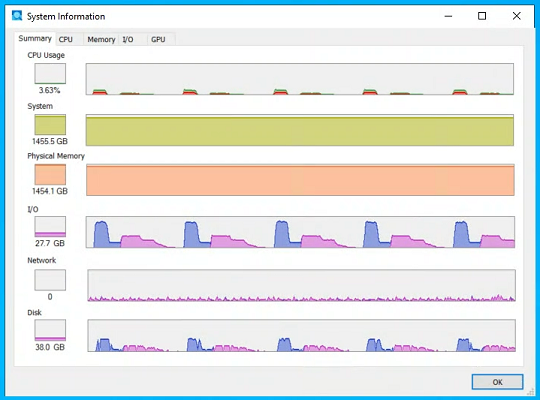
Non-direct Attached Storage:
The first problem was the indirect attached storage. In last year's computation, all 19 SSDs were direct attached to the motherboard. In this computation, 30 SSDs were used for swap of which 6 were direct attached while the remaining 24 were external and connected via a pair of PCIe connections. It is these PCIe connections that became the bottleneck.
The result is that 6 of the SSDs were very fast while the remaining 24 were slow. Thus on every burst of I/O, the bandwidth would start fast. Once the 6 fast SSDs finished, the remaining 24 were still running at a much lower speed.
Write bandwidth was also poor due to QLC SSDs having inconsistent performance depending on the state of their SLC cache. So on every burst of writes, there would always be 1 or 2 SSDs which take much longer to finish than the rest (i.e. "stragglers"). And the nature of RAID-0 is that performance is bottlenecked by the slowest drive.
It's unclear if this is a regression from last year's run, but it certainly didn't show up during the pre-run I/O benchmarks when the SSDs were mostly empty and had a clean cache state.
Amdahl's Law and Zen4 Hazard:
The second problem was the Amdahl's Law and Zen4 Hazard problem. While we knew this would be a problem before starting the run, the fix for it was not going to be ready for months. But since this problem has already existed for years, it isn't considered a regression from last year's 100 trillion digit speedun. But it did contribute to missing the original 1 month target.
As of today, we're unable to quantify how much it slowed down the computation. But empirically speaking, whenever Jordan checked on the computation, it was showing 0% CPU+disk utilization more often than not. And unlike Emma's records with Google a few years back, there was no logging of CPU and disk utilization. So we don't have the data to analyze.
Suboptimal Algorithm Selection:
The last performance issue showed up late in the computation and is a bug in y-cruncher. After I was given remote access to the machine and was able to monitor the computation more closely, I noticed that it was often choosing very poor algorithm parameters. The result was a noticeable slow-down on some of the larger operations. While it's also difficult to quantify its effect on the whole computation, it definitely slowed down the final division and square root steps by around 50%.
This bug was then fixed for v0.8.4. But I decided not to apply it to this computation since it was nearing completion and it was safer to not touch it anymore than was absolutely necessary.
In the end, it's difficult to know how much the computation was slowed down by all these issues. At least not without rerunning it with all the software fixes and hardware adjustments in place. But of course the problems didn't stop with just poor performance...
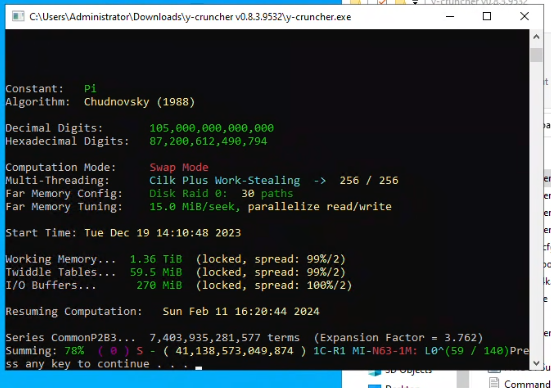
|
| y-cruncher crashes with no error message. |
Late Computation Crash:
Near the end of the computation, the program mysteriously crashed without an error message. When it was restarted from the last save point, it crashed again at the same place a day later. So the alarm bells started going off because it's clear at this point that there's an issue with the program.
To make matters worse:
- y-cruncher rarely just *crashes* unless the hardware is very unstable. The fact that it crashed twice in exactly the same spot immediately implies that it is not a hardware instability.
- When y-cruncher encounters an error, it's supposed to print an error message. No error was printed.
- When y-cruncher crashes on Windows, it catches the fault and creates a minidump file for itself that can be sent to me to debug. It failed to do that as well.
The vast majority of subtle hardware errors do not crash the program. Instead they trigger redundancy check failures which always get printed on the screen. But there was nothing. The application process literally just died.
But there was one thing I remembered: In Windows, crash handlers do not work if the crash is from heap corruption. Thus if y-cruncher crashed due to heap corruption, the crash handler that creates its own minidump does not run. Furthermore, early in January, I fixed a bug for v0.8.4 that could cause y-cruncher to crash if an error occurred at the right time.
When y-cruncher encounters an error, it throws an exception which is supposed to propagate up the execution stack until it is caught at higher level and printed out. What was happening instead was an async object lifetime bug. The exception causes a premature stack unwind on the thread that owns an object. So the object gets destructed while other threads are still using it. (yeah, typical C++ bs) Thus the use-after-free would corrupt the heap and crash the program - bypassing the crash handler and terminating the progran before it has a chance to print the error message.
Cross-checking the exact point of the crash confirms that it was in the right place where this could happen. So that probably explains the silent crash.
But what was the original exception? Obviously I wouldn't know until I backported the fix from v0.8.4 to v0.8.3 and reran the computation to the failure spot and (hopefully) have an error message to see this time.
(By this point, I had been given full remote access to the machine to do whatever I needed with the machine and the (incomplete) computation. So in addition to the patched binary, the program was now running under a debugger. Because yes, we're going to compute 105 trillion digits of Pi on Windows through the Visual Studio IDE in case of further shenanigans.)
But based on the last printed status line, I had a rough idea of where the program was during the error. Thus I kind of already knew what the error message would be. (The dreaded "Coefficient is too large" error.) So I wasn't going to wait a day for the program to hit the error again and troll me with the same message that it trolls overclockers with bad ram. Thus I started looking into the code near the crash and the likely sources of error. While I wasn't expecting to find the actual error, I was at least looking for places to add debugging code.
Then after going through many spots, mentally injecting errors, and simulating how the program would fail, I found one spot that matched what was happening. It was deep inside the AVX512 codepath of the N63 multiply algorithm.
Without getting into the details of the code and the algorithm that it implemented (since that would require a multi-page blog to cover), there was some floating-point arithmetic that was incorrectly written in a way that led to loss of precision due to destructive cancellation. It was so bad that I still don't understand how it ever worked at all. Yet the code ran correctly in my manual tests, passed weeks and weeks of unit and integration tests, and even passed a bunch of Jordan's recent large computations of other constants. And as luck would have it, it only blew up on a 40 trillion digit multiply while attempting a Pi record.
Fast forward 2 more days (with further delays caused by the system getting knocked offline by someone physically bumping into it), the program (with a fix implemented) successfully ran through the failure spot. From there, the rest of the computation finished without further incidents and the digits verified correct.
So this bug I found by visual inspection indeed was the bug that was causing all of this. Had this not been the case, things could've gone really bad. 24 hour repro time. $100k+ of hardware being tied up. Half a million lines of code.
Post Mortem:
So what happened? How did I screw this up?
Well... Move fast and break things... and get very unlucky.
Last year, ~70% of the code relevant to Pi was rewritten. And it all happened in a relatively short amount of time (140,000 lines of code over 9 months).
Normally, development is slow and I spend a lot of time validating what I do before moving on. Then there is the implicit (and outsourced) testing of just letting the program soak in the public for a long time while making incremental improvements. Each time someone submits a large run (or a Pi record) it would basically serve as extra validation of what has been done so far.
None of this happened last year as basically the entire program was replaced all at once. And because the task was so big, I started getting impatient to see results. So that meant cutting corners with some of the manual validation that normally happens during incremental development. In other words, the rewrites of v0.8.x lacked both the internal and public testing that y-cruncher normally goes through and became too reliant on internal automated testing.
In the end, quite a few bugs slipped through - 3 of which showed up in this computation:
- The object lifetime bug skirted testing because it only happens during error handling which was not part of the automated test coverage.
- The suboptimal algorithm selection passed testing because the vast majority of tests only check for correctness and not performance.
- The N63 multiply bug only seems to happen on sizes far beyond the capability of my own hardware.
The N63 multiply bug is the rather unfortunate one as the relevant code was copy/pasted from elsewhere in the program where it had already been proven correct. But in my haste to get things done, I had not realized that the preconditions had changed in a way that invalided both the proof and the code itself.
As luck would have it, the code only breaks on sizes far beyond the scope of the automated tests and far beyond what my own hardware is even capable of. So once the bug was in and I had already moved on to other things, it had no chance of being caught. So someone would've had to find it for me. And that ended up being this 105 trillion digit Pi record attempt.
All 3 bugs were part of the newly rewritten code. The Amdahl's Law/Zen4 Hazard predated the rewrite and is not considered a bug as the code was behaving as originally intended. All of these (including the Amdahl's Law/Zen4 Hazard) have been fixed in the latest release (v0.8.4). So hopefully stability will improve going forward.
You could argue that "move fast and break things" is the right way to approach things that don't involve human safety. And I would agree - except that I don't have the resources to clean up the resulting mess when things break at such scales. It only worked out this time because Jordan, StorageReview, and the relevant hardware sponsors had the patience to let me use their hardware to sort everything out.
Version 0.8.4 Released: (February 21, 2024) - permalink
y-cruncher v0.8.4 has been released with most of the improvements in non-Pi related math as well as continued improvements for large computations in swap mode.
For the purpose of competitive benchmarking, v0.8.4 does have changes that theoretically affect performance of the benchmark-relevant computations. But so far I have yet to be able to measure any difference. So until someone proves me wrong, I declare that v0.8.4 benchmarks are comparable to both v0.8.3 and v0.8.2 for both competitive benchmarking and hardware reviews.
New Math Improvements:
Jorge Zuniga has done it again! This time with new fastest formulas for Log(2), Log(3), and Log(5). You can grab the formula files here:
- Log(2) - Zuniga (2024-i).cfg
- Log(2) - Zuniga (2024-ii).cfg
- Log(3) - Zuniga (2024-i).cfg
- Log(5) - Zuniga (2024-i).cfg
More information on MathOverflow.
Log(2) is one of the most fundumental constants and is used in many places such as the AGM algorithm for the logarithm and the Euler-Mascheroni Constant. It has been decades since the last time Log(2) has had a new fastest formula, but Jorge has found one that's 50% faster!
y-cruncher v0.8.4 will special-case for these values and will use these formulas instead of the auto-generated ArcCoth() Machin-like formulas.
And on a somewhat related note, the custom formula feature has gone through some rework and now has some new functionality:
- Square(x)
- Reciprocal(x)
- Log2
- Exp(x)
- All hyperbolic trig functions.
- All inverse hyperbolic trig functions.
- Power(x, y) now supports non-integer powers.
Some of these are convenience wrappers of existing functionality while others are entirely new. And as before, all custom formula functionality supports swap mode with checkpointing and can therefore be taken up to billions/trillions of digits if desired.
The main addition is the exponential function exp(x). This has been a notable omission given that log(x) has been supported since first release of the custom formula feature. And now that exp(x) has finally been added, it unlocks the non-integer power function as well as the rest of the hyperbolic trigonometric functions.
With that we get a new category of constants. A sample of which include:
- Ramanujan's Constant.cfg
- Gelfond-Schneider Constant.cfg
- Sqrt(2)^Sqrt(2).cfg
- exp(Pi) - Direct.cfg (was previously accessible using a hypergeometric series)
- Pi^e.cfg
I'll note that while y-cruncher supports exp(x), it's rather slow to evaluate. Supporting it at all was more important than making it performance optimal. Nevertheless, it is still quasi-linear in run-time, so you can (in theory) compute exp(x) for non-trivial x to trillions of digits. But it will be a longer wait given the massive implied big-O constant.
Improvements for Large Computations:
Now we move onto the same old stuff that's been going on since v0.8.2 - improvements relevant to very large computations.
Three main things have changed here:
- The limit of y-cruncher has been increased from 1 x 10¹⁵ to 108 x 1015 decimal digits.
- Checkpointing is now supported inside the radix conversion.
- The Amdahl's Law and AMD superalignment shenanigans has been fixed.
Increasing the Limit from 1 x 10¹⁵ digits to 108 x 1015 digits:
Historically, y-cruncher has been capped to 1 x 10¹⁵ digits. And with the Pi record currently sitting at 100 trillion digits (1 x 10¹⁴), it's not hard to imagine the limit being reached in the near future - possibly within a few years.
The 1 x 10¹⁵ digits comes from what I call the "float-indexing limit". It is the use of double-precision for program "flow control parameters". For example:
- If I want to compute N digits of Pi, I need to know how many terms of the series to sum up. To determine that, I need to divide N by the convergence rate of the series. Since the convergence rate is not an integer, this operation uses floating-point.
- The series for e has factorials in the denominator. To calculate how much memory it takes to store those factorials, I need to use Stirling's formula for approximating the LogGamma function. Needless to say, this also needs floating-point arithmetic, and lots of it.
Given that double-precision only has around 16 digits of precision, it begins to run out for computations that approach that many digits. And since it's difficult to pin-point exactly when round-off becomes problematic, y-cruncher has been artificially capped at 1015 digits as a safe limit.
As of v0.8.4, all uses of "float-indexing" is now done using a higher-precision data type, thus eliminating this limit of 1015 digits. And with one limit removed, the next lowest limit kicks in which (as of this writing) is likely to be 108 x 1015 from the limit of the current 64-bit NTT implementation. Going beyond that gets uncertain as many things begin to overflow 64-bit integers. Fortunately, that will not be a problem for decades to come.
Checkpointing the Radix Conversion:
Moving on... Checkpointing is crucial to large computations because it allows the program to resume a run after being interrupted. Without checkpointing, the recent Pi records wouldn't be achievable as it's virtually impossible to keep a large machine running under stress for so many months without something breaking.
For checkpointing to be useful, they must be frequent enough that the computer can easily reach the next checkpoint without failing. If the time between two checkpoints exceeds the MTTF (Mean Time to Failure), it becomes difficult to make forward progress since it'll likely require multiple attempts to cross the gap. For this reason, 90% of y-cruncher does frequent checkpoints.
That remaining 10% is the radix conversion. This operation has never supported checkpointing because the algorithm is in-place and destructive. Meaning that it constantly overwrites its own dataset making it difficult to checkpoint because you can't roll back to data that has been overwritten. Over the years, the lack of checkpointing here has become a big enough problem that several of the Pi records have indeed required multiple attempts to get through the conversion. So it has become a liability that is getting worse as the record gets pushed higher and higher.
The difficulty of solving this combined with a lot of tech-debt in the implementation meant that I kept procrastinating it for years. And it would require rewriting the algorithm with a completely new approach. As the years went by, the old radix conversion became the last thing that was still using double-precision float-indexing. Thus it got to the point where the old radix conversion was holding back two things: checkpointing and y-cruncher's size limit.
So for v0.8.4, I finally bit the bullet and did that much needed redesign+rewrite of the entire swap mode radix conversion.
While the new radix conversion supports checkpointing, it still has a higher-than-normal chance of a failure corrupting a checkpoint due the close spatial proximity of data writes to checkpointed data. So in preparation for this, support for multiple levels of checkpointing was added in the previous version (v0.8.3) that will give you multiple points to roll back to in the event of an interruption. For the radix conversion, it means having the option to roll back to before the conversion should the mid-conversion checkpoint become corrupted.
And lastly, the Amdahl's Law and AMD superalignment issue has been fixed. It seems that the problem was worse than I had initially thought. So bad that even Intel servers are sometimes outperforming the AMD ones for large swap mode computations. So this will be a very much welcomed improvement bugfix for AMD servers.
----
And that should be it for this release. As with all new releases that touch critical infrastructure, I strongly recommend testing at scale before attempting any long running computation (like a Pi record attempt). My own testing capability is of course limited to the (rather modest) hardware that I personally own. For this release, that piece of "critical infrastructure" is of course the radix conversion.
Version 0.8.3 Patched: (February 13, 2024) - permalink
A new patch for v0.8.3 has been released that fixes a serious bug in the N63 large multiply algorithm. The bug only affects specific versions and binaries.
The affected binaries are:
- v0.8.2: 18-CNL ~ Shinoa
- v0.8.2: 22-ZN4 ~ Kizuna
- v0.8.3: 18-CNL ~ Shinoa
- v0.8.3: 22-ZN4 ~ Kizuna
Both Windows and Linux are affected. And can only happen on computations above 29 trillion digits with the likelihood increasing for larger sizes. While this bug affects very few people, it is severe for those who are as it can block record attempts.
FLINT: The Rising Star of Bignum Libraries: (February 9, 2024) - permalink
So apparently there's a new crown for the fastest open-sourced bignum library. It is FLINT (Fast Library for Number Theory).
Historically, the "main" open-sourced bignum library was GMP which was (and still is) used by everything from computer algebra systems, to Python, to even the GCC compiler. It (along with its fork, MPIR) was also the fastest bignum library out there.
In the past, I used to follow both GMP and MPIR. But development on both stagnated around 10 years ago, which caused me to tune out of the field as a whole. And because of that, I completely missed the rise of the FLINT library which seems to have taken the scene by storm.
In simple terms, FLINT is a modern bignum library that supports SIMD and parallel computing - the very two things that GMP has failed to embrace. With AVX2, it beats GMP by 3x in raw speed and blows it out once any sort of parallelism is enabled.
With GMP left in the dust, the next natural thing to compare it to is... y-cruncher. But to be clear, this is not a fair comparison. FLINT is generic library that can do a zillion things that y-cruncher cannot. And y-cruncher is specialized to do one thing - compute Pi. So they are different programs with different purposes that happen to overlap in some functionality. The fact that we're even here shows how far FLINT has come.
So we'll be comparing the following programs:
- Parallel GMP Chudnovsky: This is a 3rd party implementation of Pi using GMP that supports parallelism as well as an optimization known as GCD factorization.
- FLINT 3.0.1: Using their example program for Pi and other constants. Compiled with their new vectorized FFT using AVX512.
- y-cruncher v0.8.3: The "22-ZN4 ~ Kizuna" binary for Zen4 processors which uses AVX512.
All 3 programs use the Chudnovsky formula. And all programs include the time needed to convert the digits to decimal representation, but not the time to output or write the digits to disk.
The benchmark system is the top-of-the-line desktop Zen4:
- AMD Ryzen 9 7950X (underclocked by lowering temperature limit to 80C)
- 192 GB DDR5 (overclocked from 3600 MT/s to 5000 MT/s)
- Ubuntu 22.04 and Windows 10 (22H2)
All benchmark times are in seconds and are in highlighted in green. Memory usage is also tracked and highlighted in blue.
Unless otherwise stated, all benchmarks were run in Ubuntu 22.04.
All computations were done entirely in memory. There is no usage of disk or swap space.
Pi - 1 thread:
| Digits | GMP (no GCD) | GMP (GCD) | FLINT 3.0.1 | y-cruncher v0.8.3 (Linux) | y-cruncher (Windows) | |||||
| 100,000,000 | 66.754 | 1.00 GB | 61.727 | 1.40 GB | 31.93 | 1.01 GB | 11.477 | 452 MB | 10.879 | 452 MB |
| 250,000,000 | 200.032 | 2.30 GB | 183.011 | 3.27 GB | 87.299 | 2.68 GB | 33.958 | 1.09 GB | 31.462 | 1.09 GB |
| 1,000,000,000 | 1,033.029 | 9.36 GB | 907.280 | 12.2 GB | 425.515 | 11.7 GB | 167.279 | 4.34 GB | 157.342 | 4.34 GB |
| 5,000,000,000 | 6,941.757 | 49.6 GB | 5,809.793 | 62.7 GB | 2,668.45 | 54.8 GB | 1,076.713 | 22.3 GB | 990.442 | 22.3 GB |
| 10,000,000,000 | 15,442.140 | 99.3 GB | 12,920.34 | 120 GB | 5,798.24 | 109 GB | 2,369.535 | 44.6 GB | 2,158.399 | 44.6 GB |
| 25,000,000,000 | Out of Memory | Out of Memory | Out of Memory | 6,568.023 | 111 GB | 6,107.845 | 111 GB | |||
The first thing we see here is that the GCD optimization gives about 10-20% speedup, but at the cost of 20% higher memory usage. This is why the program has a toggle to enable/disable GCD.
FLINT beats GMP by 2-3x. These results are consistent with their own reported benchmarks confirming that I've at least correctly compiled it. And as they mention, FLINT does not do the GCD optimization. A 2-3x gain over the existing state-of-the-art is a huge.
With this beatdown of GMP, it brings FLINT within a factor of 3 of y-cruncher. My benchmarks here show a slightly wider gap between FLINT and y-cruncher than what they have. But it is a different machine and I'm not sure if FLINT actually uses AVX512 despite having a flag for it (--enable-avx512). Regardless, AVX512 doesn't bring huge gains over AVX2 on Zen4 for pure floating-point workloads such as the type of algorithm that they are using.
For a generic library, this is very impressive as it probably lacks many of the specialized optimizations that y-cruncher does. (though worth noting that y-cruncher also does not do the GCD optimization)
Moving over to memory usage, both GMP and FLINT use more than twice the memory that y-cruncher does. This is reasonable since y-cruncher does make a substantial effort reduce its memory usage. (more on this later)
So FLINT is looking very good so far. Now let's enable some parallelism...
Pi - 32 threads:
| Digits | GMP (no GCD) | GMP (GCD) | FLINT 3.0.1 | y-cruncher v0.8.3 (Linux) | y-cruncher (Windows) | |||||
| 100,000,000 | 23.773 | 1.25 GB | 17.862 | 1.80 GB | 6.386 | 4.52 GB | 1.559 | 507 MB | 1.455 | 507 MB |
| 250,000,000 | 65.799 | 3.32 GB | 50.188 | 4.29 GB | 19.438 | 9.80 GB | 4.234 | 1.15 GB | 4.079 | 1.15 GB |
| 1,000,000,000 | 317.333 | 12.4 GB | 224.57 | 16.6 GB | 95.201 | 34.3 GB | 19.428 | 4.40 GB | 18.793 | 4.40 GB |
| 5,000,000,000 | 2,004.362 | 51.7 GB | 1,312.231 | 74.6 GB | 550.325 | 138 GB | 113.422 | 22.3 GB | 111.467 | 22.3 GB |
| 10,000,000,000 | 4,275.017 | 99.2 GB | 2,872.915 | 141 GB | Out of Memory | 252.495 | 44.7 GB | 242.246 | 44.7 GB | |
| 25,000,000,000 | Out of Memory | Out of Memory | Out of Memory | 714.804 | 111 GB | 683.368 | 111 GB | |||
As this is a 16-core machine with hyperthreading, the maximum speedup expected would be on the order of 16x. But because of power throttling, turbo limits, and other resource bottlenecks, actual parallel speedups will fall well short of that.
The first thing we see here is that y-cruncher scales better than both GMP and FLINT as the performance gap grows to 12x and 5x respectively. From watching the Ubuntu System Monitor, it is obvious that Amdahl's Law is having an effect. Both GMP and FLINT spend significant amounts of time running code that is either not parallelized or is under-parallelized. With such a big loss to Amdahl's Law, it becomes difficult to gauge if any other bottlenecks come into play. Memory bandwidth is the one I was most interested in because that is y-cruncher's achilles heel. Maybe I'll revisit this in the future if/when FLINT is able to approach 100% CPU utilization.
But the elephant in the room is FLINT's memory usage - which skyrockets to more than 2x of what GMP needs and 5x of what y-cruncher needs. So while both GMP and y-cruncher manage to avoid blowing up memory when parallelizing, FLINT does not.
I didn't try very hard to see what FLINT is doing wrong, but I suspect it may be parallelizing at too high a level. Parallelizing at the highest level of an algorithm tends to result in memory usage that grows linearly with the # of threads until the entire working set is in memory simultaneously.
Both the 3rd party GMP Pi implementation and y-cruncher serialize the upper levels of the computation specifically to avoid blowing up memory. But while this approach reduces memory usage, it is not a free optimization and can have negative performance impact. So it's a space-time trade-off.
y-cruncher, which is aimed at extremely large computations, tries to strike a balance between speed and memory efficiency. So it trades away some speed to use less memory since it allows bigger computations to be done. Some of the old classic Pi programs like PiFast also do this. PiFast even makes this tunable where you can select how much speed to trade away to reduce memory.
Euler-Mascheroni Constant - 32 threads:
The memory explosion when parallelizing tends to get worse for slower constants. So lets look at the Euler-Mascheroni Constant - which is much slower than Pi.
And sure enough, FLINT memory usage spikes to nearly 20x of y-cruncher.
| Digits | FLINT 3.0.1 | y-cruncher v0.8.3 (Linux) | y-cruncher (Windows) | |||
| 10,000,000 | 9.037 | 2.35 GB | 3.274 | 243 MB | 2.427 | 243 MB |
| 100,000,000 | 141.718 | 14.3 GB | 36.999 | 795 MB | 34.928 | 795 MB |
| 1,000,000,000 | 2,038.47 | 138 GB | 575.467 | 7.07 GB | 560.219 | 7.07 GB |
| 10,000,000,000 | Out of Memory | 7,139.21 | 68.6 GB | 7,005.28 | 68.6 GB | |
While this looks pretty bad, it is likely far beyond what FLINT is designed for and thus not on the developer's radar. The Euler-Mascheroni Constant is also far less common than Pi and thus gets much less attention (both in usage and developer time).
Overall, FLINT has come a long way since the days of GMP's dominance. Pushing it to its limit does reveal some glaring inefficiencies which (if I've correctly accessed them), are probably easy to fix. So while I don't expect FLINT to beat y-cruncher any time soon, it's likely a few easy optimizations away from coming a lot closer.